Graph of function
1. Purpose of the program
The program accepts data from the user, calculates the values of the formula: Y(X)=a1*sin(b1*X)+a2*sin(b2*X)+a3*sin(b3*X), outputs the values as a table and builds a graph.
1.1. Input data
The user must enter the following parameters:
- The starting coordinate Х(Х0) - the floating-point number
- The end coordinate Х(Хк) - the floating-point number
- Step(∆Х) - the floating-point number
- Coefficients: a1, a2, a3, b1, b2, b3 integers
1.2. Output data
At the output, the program will show the following results:
- Vectors with values X and Y in the form of a table with the possibility of editing
- Graph Y(X) based on the results of the formula calculation
- ANSI-encoded text file, where each line is separated by dots, and the coordinates in the line are separated by semicolons
2. Project structure
| File name | The contents of the file |
|---|---|
| GR_HEAD.H | List of connected libraries, declarations of global variables, class prototype Coordinate function prototypes |
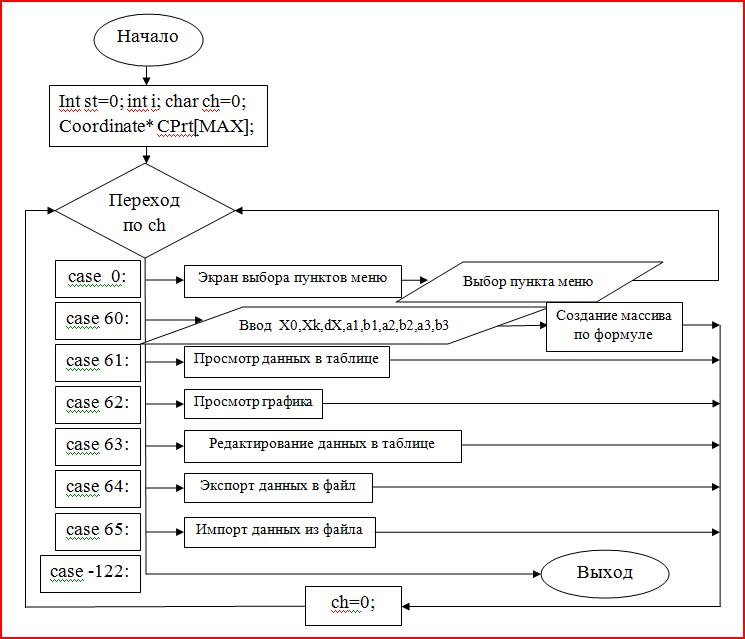
| GR_MAIN.CPP | The list of connected files and the main() function, in which the main algorithm of the program is executed(рис. 1.) |
| GR_PROC.CPP | Description of the Coordinate class and definitions of functions related to processing data of this class |
| GR_INTRF.CPP | Definitions of auxiliary functions of the program display of the graph on the screen |
| GR_RW.CPP | File write and read function definitions |
3. Алгоритм программы
The algorithm of the main menu is shown below:
4. Compilation
The program code was written in C++ using a programming environment Borland 3.1 The choice of this development environment was determined by the principle of “necessary and sufficient”. The result of the compilation will be a console application.
5. Working in the program
Let’s look at the interaction with the program on a small example.
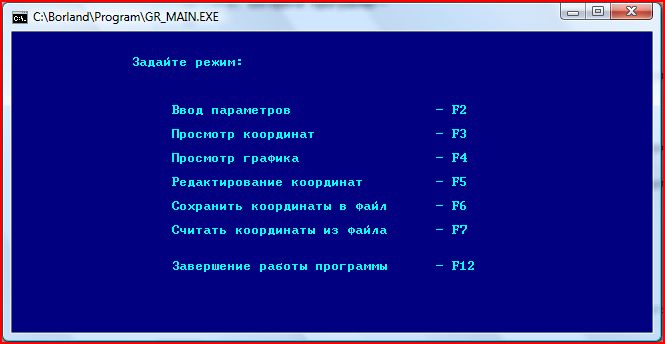
5.1. After the launch, the main menu of the program will be available.
5.2. Entering parameters
Press «F2» to open the window «Enter parameters» and enter the values X_0, X_k, ∆X, a_1, b_1, a_2, b_2, a_3, b_3(pic.3.)
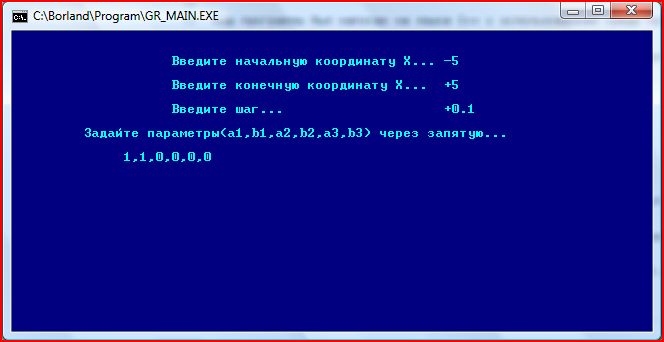
Press «Enter».
5.3. Table of results
After that, we will see a table of the values of the Х and Y functions: Y(X)=a1*sin(b1*X)+a2*sin(b2*X)+a3*sin(b3*X)

The same table opens when you press «F3» in the main menu. You can view the entire table using the keys «↑» and «↓».
5.4. Geaph of the function
After pressing «Enter» or «Esc» the graph of the function Y(X) appears.

(available by clicking «F4» in the main menu). Pressing any key returns us to the main menu..
5.5. Editing a table
To edit the data in the main menu, press the key «F5».
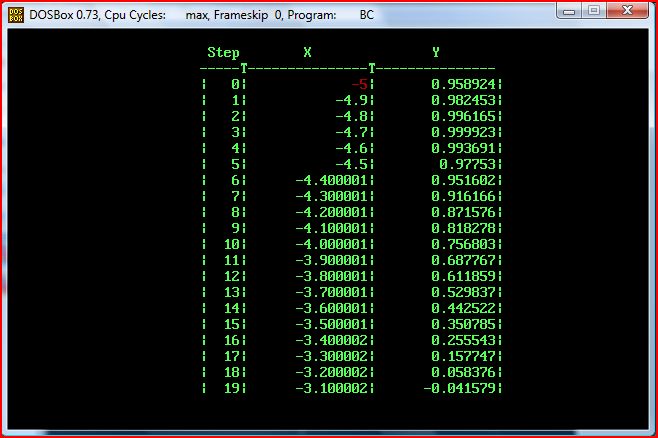
The coordinate that is active for editing is highlighted in red.
To select a different coordinate, press the keys «↑», «↓», «←», «→» or «Tab».
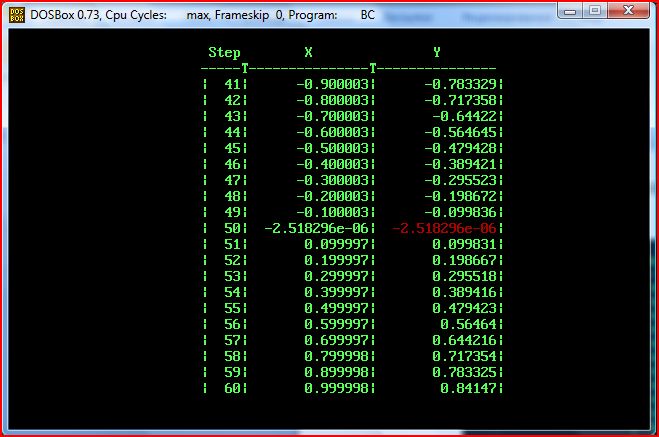
To start editing, press the «Backspace» key and enter the required value.
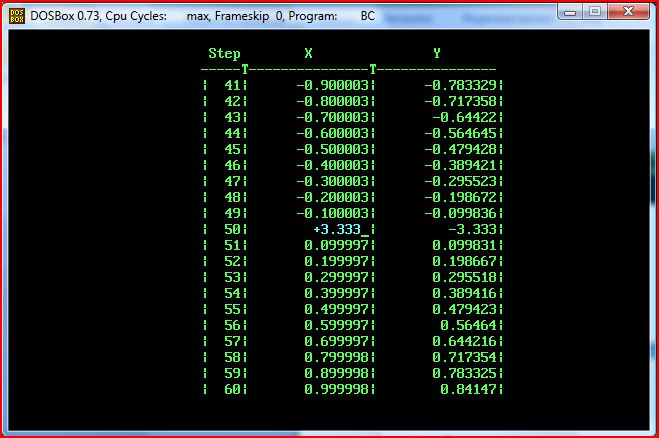
To save this value, press «Enter». To exit the edit mode, press «Enter» again.
A new graph of the function will appear in front of us:

5.6. Save the results
To save the data to a file in the main menu, press «F6»
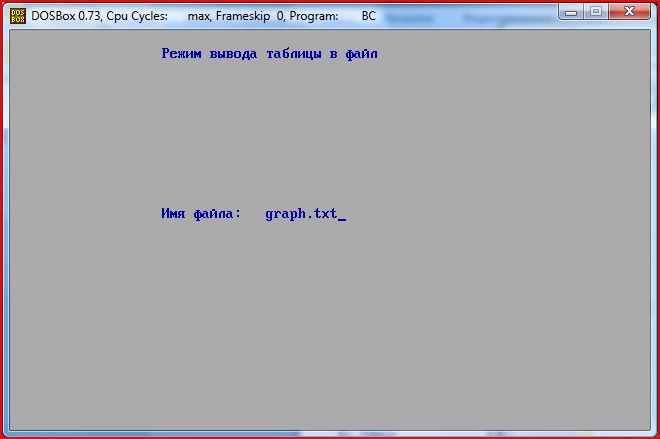
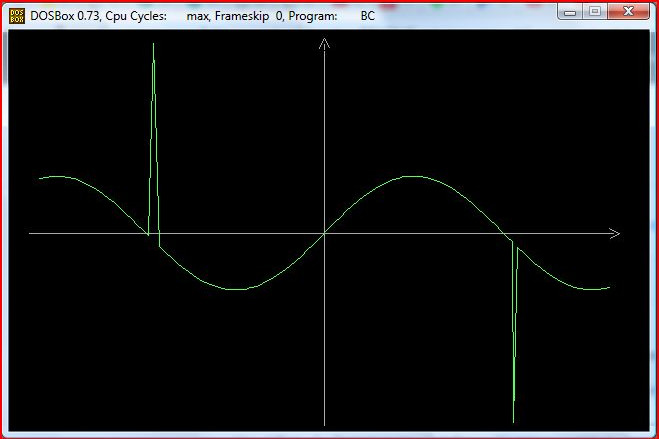
As a result, a file with the coordinates of the specified graph will appear in the program directory

You can edit the file in notepad, save it, and then read it.
5.7. Read the results
To read data from a file, in the main menu, press «F7», enter the path to the file and press «Enter».
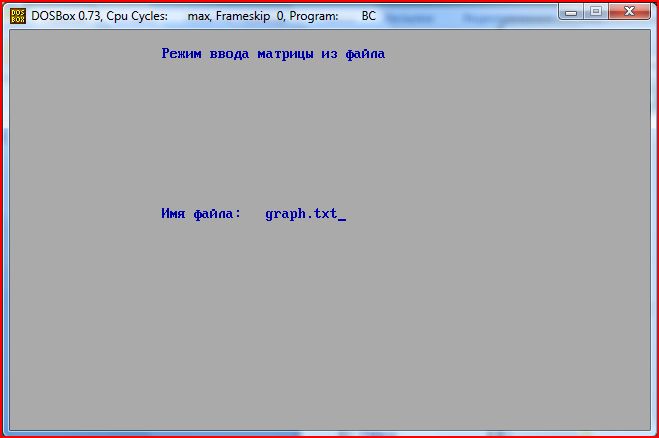
A graph will appear in the window with the changes that we made in the file:
6. Exit
By pressing the «F12» key, the program is terminated normally.
Thank you for your interest! :)