Health control
1. Purpose of the program
The Health Control app is designed to monitor your health status according to the main vital indicators. Such as systolic and diastolic blood pressure, pulse, temperature, and blood sugar levels.
1.1. Input data
The user must enter the following parameters:
- Systolic and diastolic blood pressure, pulse
- Temperature
- The sugar content in the blood
1.2. Output data
Based on the collected data, the user is provided with:
- Graph of changes in indicators during the observation period
- Maximum, minimum, and average values
1.3. Supported Platforms
- Android 4.2.2
2. Project structure
| Class name | The contents of the file |
|---|---|
| MainActivity | Contains the source code of the main window displayed when the application is launched |
| SPrefManager | Creating and managing app settings |
| Database | It is used for creating and managing the SQLite database |
| DBLoader | Implements loading of metric values from the database |
| EntriesList | Implements data display in TabLayout |
| Graphics | Implements graph display in TabLayout |
| GraphViewManager | Controls the display of graphs of changes in indicators |
| Statistics | Implements statistics display in TabLayout |
| StatisticsModel | Data model for storing statistics in RAM |
| StatisticsLoader | Implements getting statistical data from the application database |
| onUIEventListener | Interface for getting data from the user |
| AddNewEntry | Thank you for your interest |
| AddBloodPressureEntry | Allows you to add blood pressure and heart rate values to the list of indicators |
| AddGlucoseEntry | Allows you to add glucose and heart rate values to the list of indicators |
| AddTemperatureEntry | Allows you to add temperature and heart rate values to the list of indicators |
| ViewPagerAdapter | Implements the display of fragments in the TabLayout |
3. Graphical user interface
The graphical user interface has been developed in accordance with the standards Material Design(the graphic design style for software and application interfaces developed by Google).
3.1. Home Screen
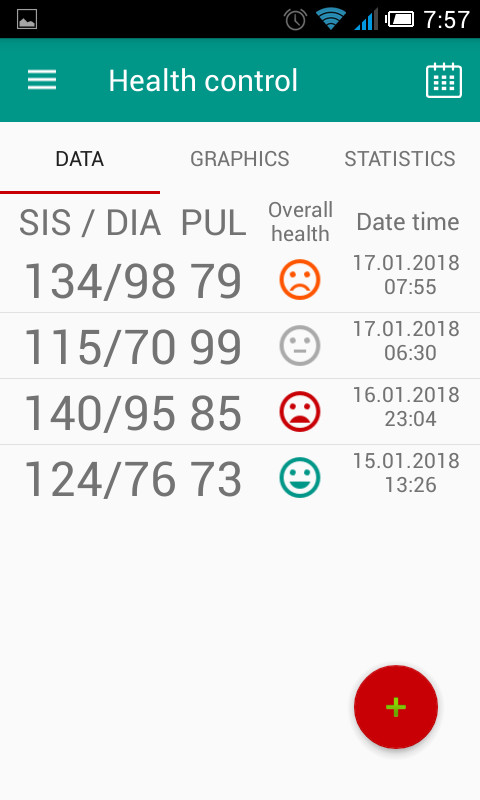
On the home screen, in the form of a TabLayout, you will see: list of indicators, graphs of changes in indicators, statistics:
3.2. Entering parameters
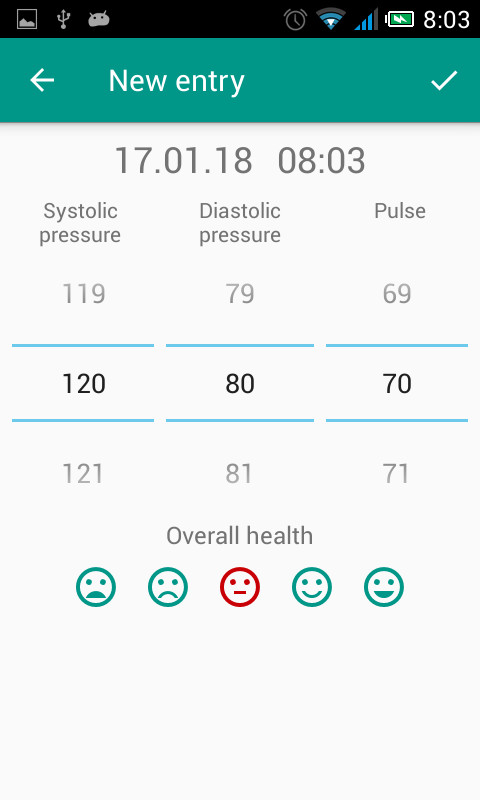
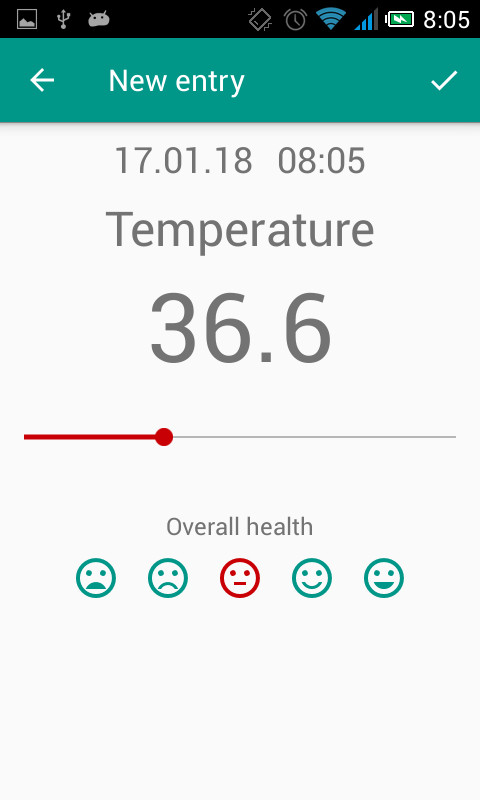
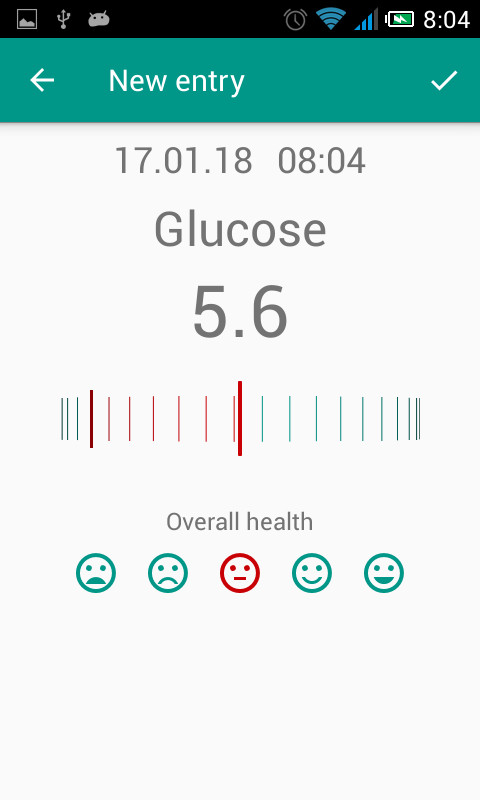
You can add an entry to the list of indicators by clicking the round button in the lower right corner. In order for the user to easily distinguish one parameter from another, adding new values is implemented using various interfaces:
4. Toolbar
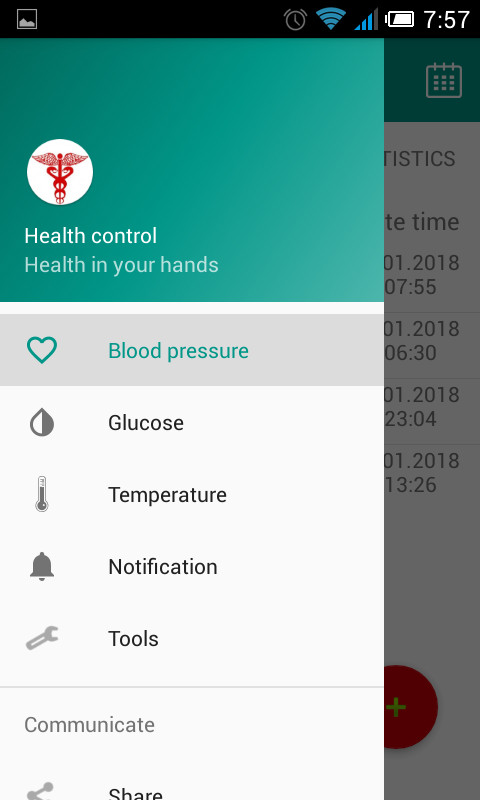
On the home screen via toolbox, you can open the navigation bar or the time interval filter using the toolbar:
The Navigation View panel contains the main menu of the app. You can use it to switch between blood pressure, temperature, and blood sugar levels.
The date filter is a dialog box that allows you to display a list of indicator values for the last week, month, year, or all the time.
Thank you for your interest! :)
